---
title: "Forecasting Web Traffic"
description: "Learn how to predict website traffic patterns using TimeGPT."
icon: "globe"
---
**Goal:** Forecast the next 7 days of daily visits to the website [cienciadedatos.net](https://cienciadedatos.net) using TimeGPT.
This tutorial is adapted from *"Forecasting web traffic with machine learning and Python"* by Joaquín Amat Rodrigo and Javier Escobar Ortiz. You will learn how to:
Obtain forecasts nearly 10% more accurate than the original method.
Use significantly fewer lines of code and simpler workflows.
Generate forecasts in substantially less computation time.
[](https://colab.research.google.com/github/Nixtla/nixtla/blob/main/nbs/docs/use-cases/1_forecasting_web_traffic.ipynb)
To start, import the required packages and initialize the Nixtla client with your API key.
```python Nixtla Client Initialization
import pandas as pd
from nixtla import NixtlaClient
nixtla_client = NixtlaClient(
api_key='my_api_key_provided_by_nixtla' # Defaults to os.environ.get("NIXTLA_API_KEY")
)
```
**Use an Azure AI endpoint**
If you are using an Azure AI endpoint, also set the `base_url` argument:
```python Azure AI Endpoint Setup
nixtla_client = NixtlaClient(
base_url="your_azure_ai_endpoint",
api_key="your_api_key"
)
```
We will load the website visit data directly from a CSV file. Then, we format the dataset by adding an identifier column named `daily_visits`.
```python Load and Format Data
url = (
'https://raw.githubusercontent.com/JoaquinAmatRodrigo/Estadistica-machine-learning-python/'
'master/data/visitas_por_dia_web_cienciadedatos.csv'
)
df = pd.read_csv(url, sep=',', parse_dates=[0], date_format='%d/%m/%y')
df['unique_id'] = 'daily_visits'
df.head(10)
```
| | date | users | unique_id |
| ----- | ------------ | ------- | -------------- |
| 0 | 2020-07-01 | 2324 | daily_visits |
| 1 | 2020-07-02 | 2201 | daily_visits |
| 2 | 2020-07-03 | 2146 | daily_visits |
| 3 | 2020-07-04 | 1666 | daily_visits |
| 4 | 2020-07-05 | 1433 | daily_visits |
| 5 | 2020-07-06 | 2195 | daily_visits |
| 6 | 2020-07-07 | 2240 | daily_visits |
| 7 | 2020-07-08 | 2295 | daily_visits |
| 8 | 2020-07-09 | 2279 | daily_visits |
| 9 | 2020-07-10 | 2155 | daily_visits |
**Note:** No further preprocessing is required before we start forecasting.
We will set up a rolling window cross-validation using TimeGPT. This will help us evaluate the forecast accuracy across multiple historic windows.
```python Cross-validation Setup
timegpt_cv_df = nixtla_client.cross_validation(
df,
h=7,
n_windows=8,
time_col='date',
target_col='users',
freq='D',
level=[80, 90, 99.5]
)
timegpt_cv_df.head()
```
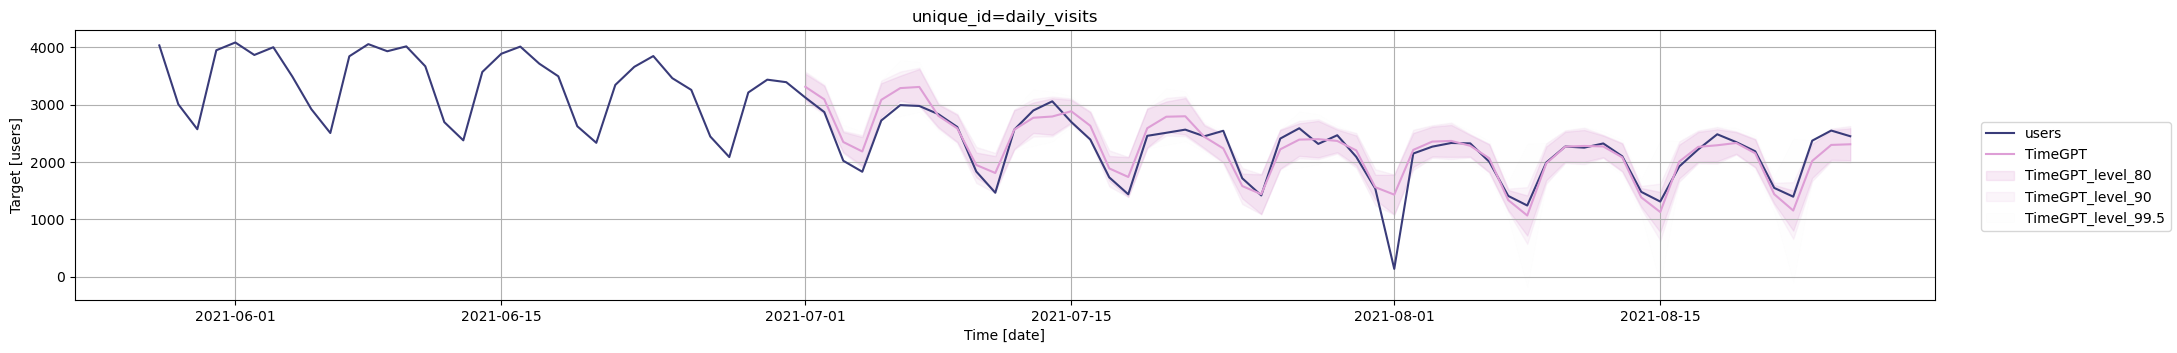
The results align closely with those from the original tutorial on [forecasting web traffic with machine learning](https://cienciadedatos.net/documentos/py37-forecasting-web-traffic-machine-learning.html).
Next, we compute the Mean Absolute Error (MAE) to quantify forecast accuracy:
```python Calculate MAE
from utilsforecast.losses import mae
mae_timegpt = mae(
df=timegpt_cv_df.drop(columns=['cutoff']),
models=['TimeGPT'],
target_col='users'
)
mae_timegpt
```
**MAE Result:** The MAE obtained is `167.69`, outperforming the original pipeline.
Exogenous variables can provide additional context that may improve forecast accuracy. In this example, we add binary indicators for each day of the week.
```python Add Weekday Indicators
for i in range(7):
df[f'week_day_{i + 1}'] = 1 * (df['date'].dt.weekday == i)
df.head(10)
```
We repeat the cross-validation with these new features:
```python Cross-validation with Exogenous Variables
timegpt_cv_df_with_ex = nixtla_client.cross_validation(
df,
h=7,
n_windows=8,
time_col='date',
target_col='users',
freq='D',
level=[80, 90, 99.5]
)
```
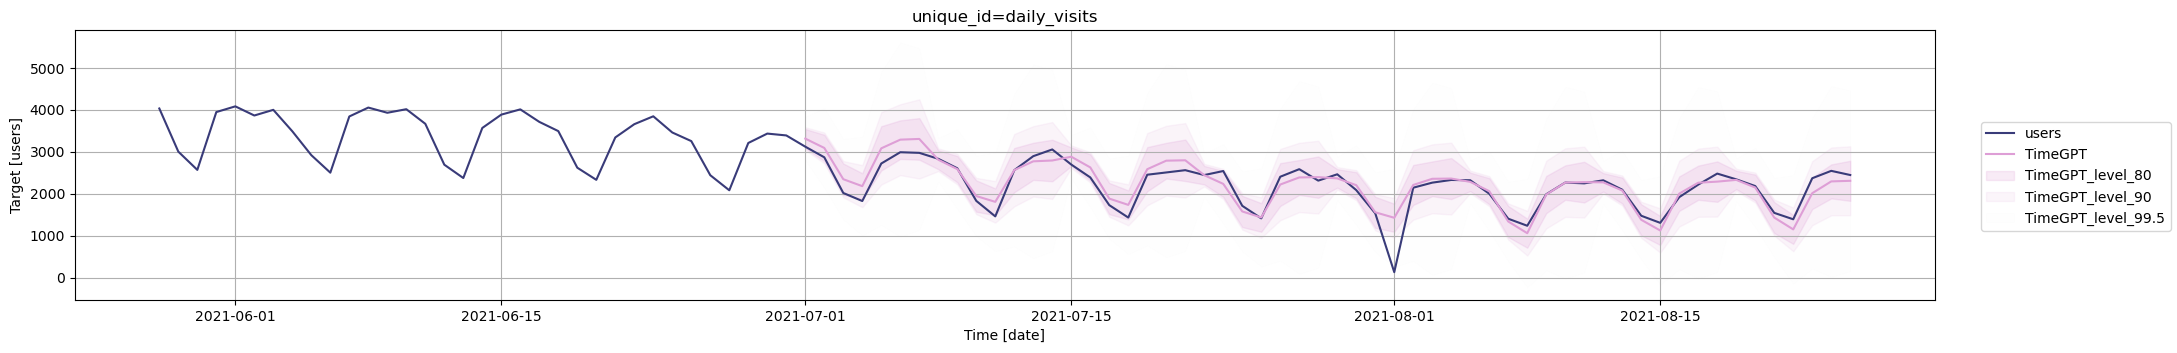
Adding weekday indicators can capture weekly seasonality in user visits.
| **Model** | **Exogenous features** | **MAE Backtest**|
| --------- | -------------------- | -------------- |
| TimeGPT | No | 167.6917 |
| TimeGPT | Yes | 167.2286 |
We see a slight improvement in MAE by including the weekday indicators. This illustrates how TimeGPT can incorporate additional signals without complex data processing or extensive model tuning.
**Key Takeaways**
- TimeGPT simplifies forecasting workflows by reducing code and tuning overhead.
- Feature engineering (like adding weekday variables) further boosts accuracy.
- Cross-validation provides a robust way to evaluate model performance.
We have demonstrated significant improvements in forecasting accuracy with minimal effort using TimeGPT. This avoids the majority of the complex steps required when building custom models—such as extensive feature engineering, validation, model comparisons, and hyperparameter tuning.
**Good luck and happy forecasting!**