---
title: "TimeGPT Quickstart (Polars)"
description: "Get started with TimeGPT using Polars for efficient data processing."
icon: "bolt-lightning"
---
TimeGPT is a production-ready, generative pretrained transformer for time series. It can make accurate predictions in just a few lines of code across domains like retail, electricity, finance, and IoT.
[](https://colab.research.google.com/github/Nixtla/nixtla/blob/main/nbs/docs/getting-started/21_polars_quickstart.ipynb)
1. Visit [dashboard.nixtla.io](https://dashboard.nixtla.io/)
2. Sign in with Google, GitHub, or email
3. Select **API Keys** in the menu, then click **Create New API Key**
4. Copy your generated API key using the provided button

```bash install-nixtla
pip install nixtla
```
```python client-setup
from nixtla import NixtlaClient
# Instantiate the NixtlaClient
nixtla_client = NixtlaClient(
api_key='my_api_key_provided_by_nixtla'
)
# Validate the API key
nixtla_client.validate_api_key()
```
For enhanced security, check [Setting Up your API Key](https://docs.nixtla.io/docs/getting-started-setting_up_your_api_key).
We use the **AirPassengers** dataset, containing monthly airline passenger totals from 1949 to 1960. This dataset is a classic example for time series forecasting.
```python load-airpassengers-data
import polars as pl
df = pl.read_csv(
'https://raw.githubusercontent.com/Nixtla/transfer-learning-time-series/main/datasets/air_passengers.csv',
try_parse_dates=True,
)
df.head()
```
| timestamp | value |
| ------------ | ------- |
| 1949-01-01 | 112 |
| 1949-02-01 | 118 |
| 1949-03-01 | 132 |
| 1949-04-01 | 129 |
| 1949-05-01 | 121 |
**Plot the dataset** for a quick visual inspection:
```python plot-airpassengers-data
nixtla_client.plot(df, time_col='timestamp', target_col='value')
```

- The target variable column should not contain missing or non-numeric values.
- Ensure there are no gaps in the timestamps.
- The time column must be of type [Date](https://docs.pola.rs/api/python/stable/reference/api/polars.datatypes.Date.html) or [Datetime](https://docs.pola.rs/api/python/stable/reference/api/polars.datatypes.Datetime.html).
For comprehensive details, visit [Data Requirements](https://docs.nixtla.io/docs/getting-started-data_requirements).
```python forecast-timegpt-12-months
timegpt_fcst_df = nixtla_client.forecast(
df=df,
h=12,
freq='1mo',
time_col='timestamp',
target_col='value'
)
timegpt_fcst_df.head()
```
Forecast values for the next 12 months:
| timestamp | TimeGPT |
| ------------ | ------------ |
| 1961-01-01 | 437.837921 |
| 1961-02-01 | 426.062714 |
| 1961-03-01 | 463.116547 |
| 1961-04-01 | 478.244507 |
| 1961-05-01 | 505.646484 |
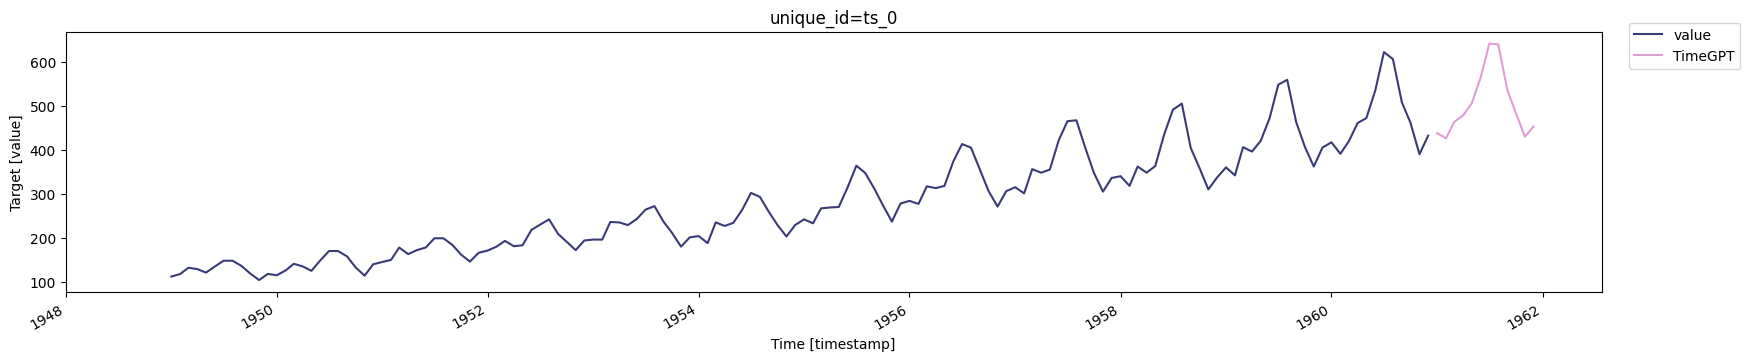
Plot the 12-month forecast alongside the actual data:
```python plot-timegpt-12-months
nixtla_client.plot(df, timegpt_fcst_df, time_col='timestamp', target_col='value')
```
When requesting `h` (horizon) values larger than the models maximum, you may see a warning.
```python forecast-timegpt-36-months
timegpt_fcst_df = nixtla_client.forecast(
df=df,
h=36,
time_col='timestamp',
target_col='value',
freq='1mo',
model='timegpt-1-long-horizon'
)
timegpt_fcst_df.head()
```
Plot the 36-month forecast results:
```python plot-timegpt-36-months
nixtla_client.plot(df, timegpt_fcst_df, time_col='timestamp', target_col='value')
```

```python forecast-timegpt-6-months
timegpt_fcst_df = nixtla_client.forecast(
df=df,
h=6,
time_col='timestamp',
target_col='value',
freq='1mo'
)
nixtla_client.plot(df, timegpt_fcst_df, time_col='timestamp', target_col='value')
```

- TimeGPT can forecast short to long horizons easily.
- Minimal setup is required—just an API key and your dataset!
- Data validation helps ensure accurate forecasts.
You are now ready to harness TimeGPT for quick and reliable time series forecasting using Polars!