---
title: "Cross-validation Tutorial"
description: "Master time series cross-validation with TimeGPT. Complete Python tutorial for model validation, rolling-window techniques, and prediction intervals with code examples."
icon: "check"
---
## What is Cross-validation?
Time series cross-validation is essential for validating machine learning models and ensuring accurate forecasts. Unlike traditional k-fold cross-validation, time series validation requires specialized rolling-window techniques that respect temporal order. This comprehensive tutorial shows you how to perform cross-validation in Python using TimeGPT, including prediction intervals, exogenous variables, and model performance evaluation.
One of the primary challenges in time series forecasting is the inherent uncertainty and variability over time, making it crucial to validate the accuracy and reliability of the models employed. Cross-validation, a robust model validation technique, is particularly adapted for this task, as it provides insights into the expected performance of a model on unseen data, ensuring the forecasts are reliable and resilient before being deployed in real-world scenarios.
TimeGPT incorporates the `cross_validation` method, designed to streamline the validation process for [time series forecasting models](/forecasting/timegpt_quickstart). This functionality enables practitioners to rigorously test their forecasting models against historical data, with support for [prediction intervals](/forecasting/probabilistic/prediction_intervals) and [exogenous variables](/forecasting/exogenous-variables/numeric_features). This tutorial will guide you through the nuanced process of conducting cross-validation within the `NixtlaClient` class, ensuring your time series forecasting models are not just well-constructed, but also validated for trustworthiness and precision.
### Why Use Cross-Validation for Time Series?
Cross-validation provides several critical benefits for time series forecasting:
- **Prevent overfitting**: Test model performance across multiple time periods
- **Validate generalization**: Ensure forecasts work on unseen data
- **Quantify uncertainty**: Generate prediction intervals for risk assessment
- **Compare models**: Evaluate different forecasting approaches systematically
- **Optimize hyperparameters**: Fine-tune model parameters with confidence
## How to Perform Cross-validation with TimeGPT
**Quick Summary**: Learn time series cross-validation with TimeGPT in Python. This tutorial covers rolling-window validation, prediction intervals, model performance metrics, and advanced techniques with real-world examples using the Peyton Manning dataset.
[](https://colab.research.google.com/github/Nixtla/nixtla/blob/main/nbs/docs/tutorials/08_cross_validation.ipynb)
### Step 1: Import Packages and Initialize NixtlaClient
First, we install and import the required packages and initialize the Nixtla client.
We start off by initializing an instance of `NixtlaClient`.
```python
import pandas as pd
from nixtla import NixtlaClient
from IPython.display import display
# Initialize TimeGPT client for cross-validation
nixtla_client = NixtlaClient(
api_key='my_api_key_provided_by_nixtla'
)
```
### Step 2: Load Example Data
Use the Peyton Manning dataset as an example. The dataset can be loaded directly from Nixtla's S3 bucket:
```python
pm_df = pd.read_csv(
'https://datasets-nixtla.s3.amazonaws.com/peyton-manning.csv'
)
```
If you are using your own data, ensure your data is properly formatted: you must have a time column (e.g., `ds`), a target column (e.g., `y`), and, if necessary, an identifier column (e.g., `unique_id`) for multiple time series.
### Step 3: Implement Rolling-Window Cross-Validation
The `cross_validation` method within the TimeGPT class is an advanced functionality crafted to perform systematic validation on time series forecasting models. This method necessitates a dataframe comprising time-ordered data and employs a rolling-window scheme to meticulously evaluate the model's performance across different time periods, thereby ensuring the model's reliability and stability over time. The animation below shows how TimeGPT performs cross-validation.

Key parameters include:
- `freq`: Frequency of your data (e.g., `'D'` for daily). If not specified, it will be inferred.
- `id_col`, `time_col`, `target_col`: Columns representing series ID, timestamps, and target values.
- `n_windows`: Number of separate validation windows.
- `step_size`: Step size between each validation window.
- `h`: Forecast horizon (e.g., the number of days ahead to predict).
In execution, `cross_validation` assesses the model's forecasting accuracy in each window, providing a robust view of the model's performance variability over time and potential overfitting. This detailed evaluation ensures the forecasts generated are not only accurate but also consistent across diverse temporal contexts.
**Key Concepts**: Rolling-window cross-validation splits your dataset into multiple training and testing sets over time. Each window moves forward chronologically, training on historical data and validating on future periods. This approach mimics real-world forecasting scenarios where you predict forward in time.
Use `cross_validation` on the Peyton Manning dataset:
```python
# Perform cross-validation with 5 windows and 7-day forecast horizon
timegpt_cv_df = nixtla_client.cross_validation(
pm_df,
h=7, # Forecast 7 days ahead
n_windows=5, # Test across 5 different time periods
freq='D' # Daily frequency
)
timegpt_cv_df.head()
```
The logs below indicate successful cross-validation calls and data preprocessing.
```bash
INFO:nixtla.nixtla_client:Validating inputs...
INFO:nixtla.nixtla_client:Querying model metadata...
INFO:nixtla.nixtla_client:Preprocessing dataframes...
INFO:nixtla.nixtla_client:Restricting input...
INFO:nixtla.nixtla_client:Calling Cross Validation Endpoint...
```
Cross-validation output includes the forecasted values (`TimeGPT`) aligned with historical values (`y`).
| unique_id | ds | cutoff | y | TimeGPT |
| ----------- | ------------ | ------------ | ---------- | ---------- |
| 0 | 2015-12-17 | 2015-12-16 | 7.591862 | 7.939553 |
| 0 | 2015-12-18 | 2015-12-16 | 7.528869 | 7.887512 |
| 0 | 2015-12-19 | 2015-12-16 | 7.171657 | 7.766617 |
| 0 | 2015-12-20 | 2015-12-16 | 7.891331 | 7.931502 |
| 0 | 2015-12-21 | 2015-12-16 | 8.360071 | 8.312632 |
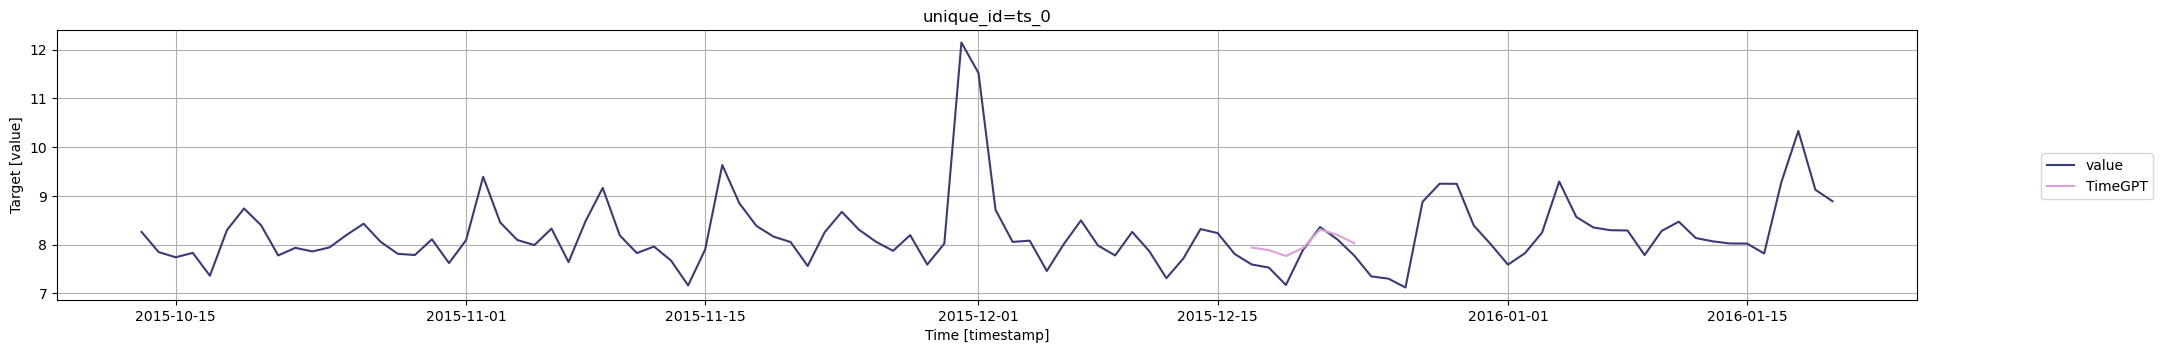
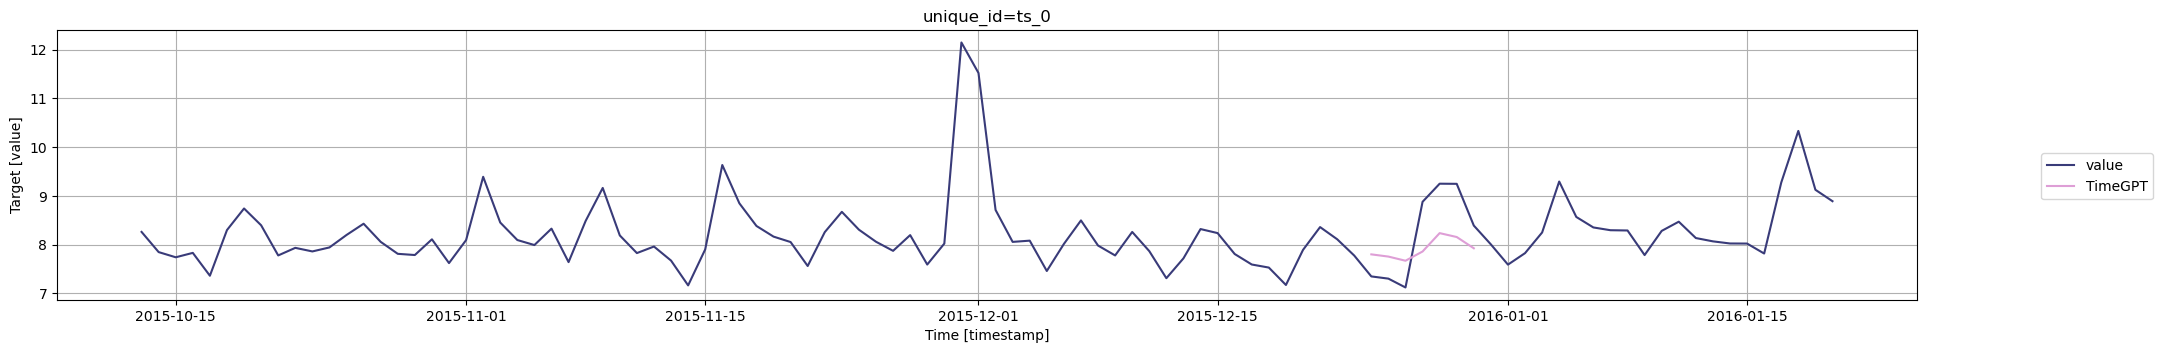
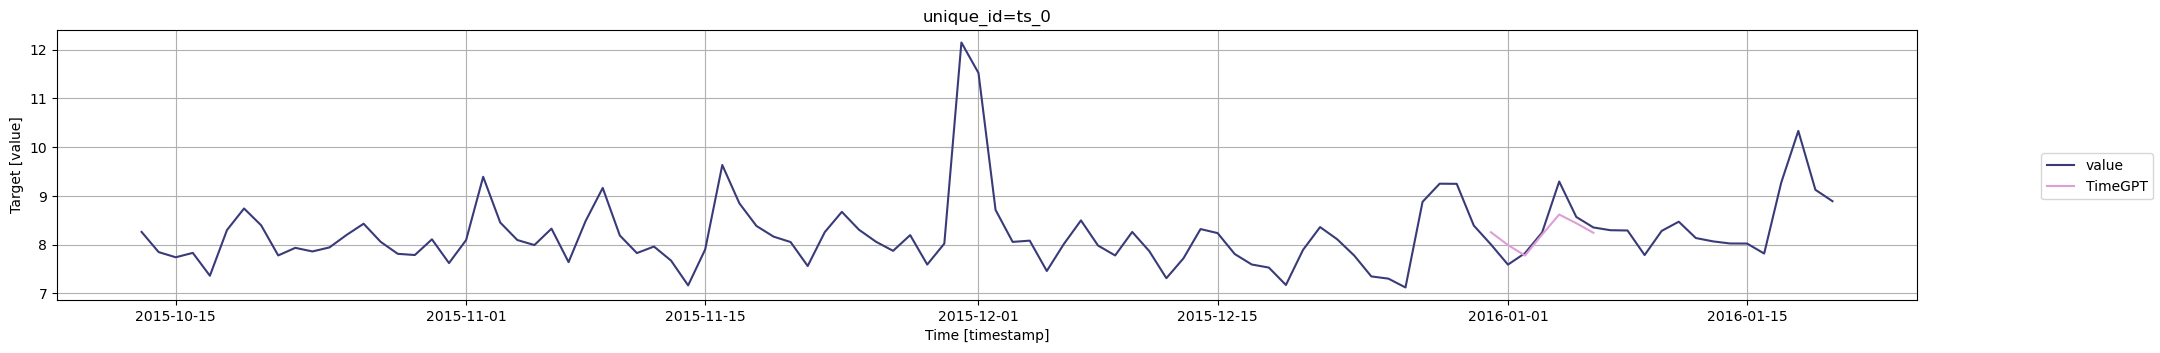
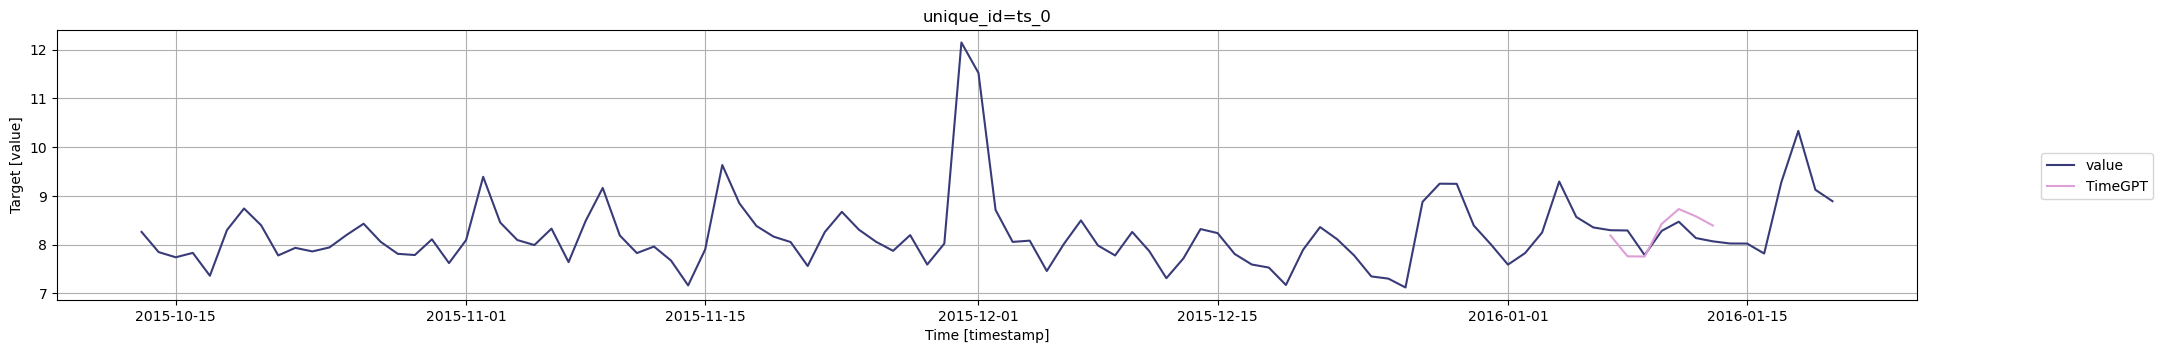
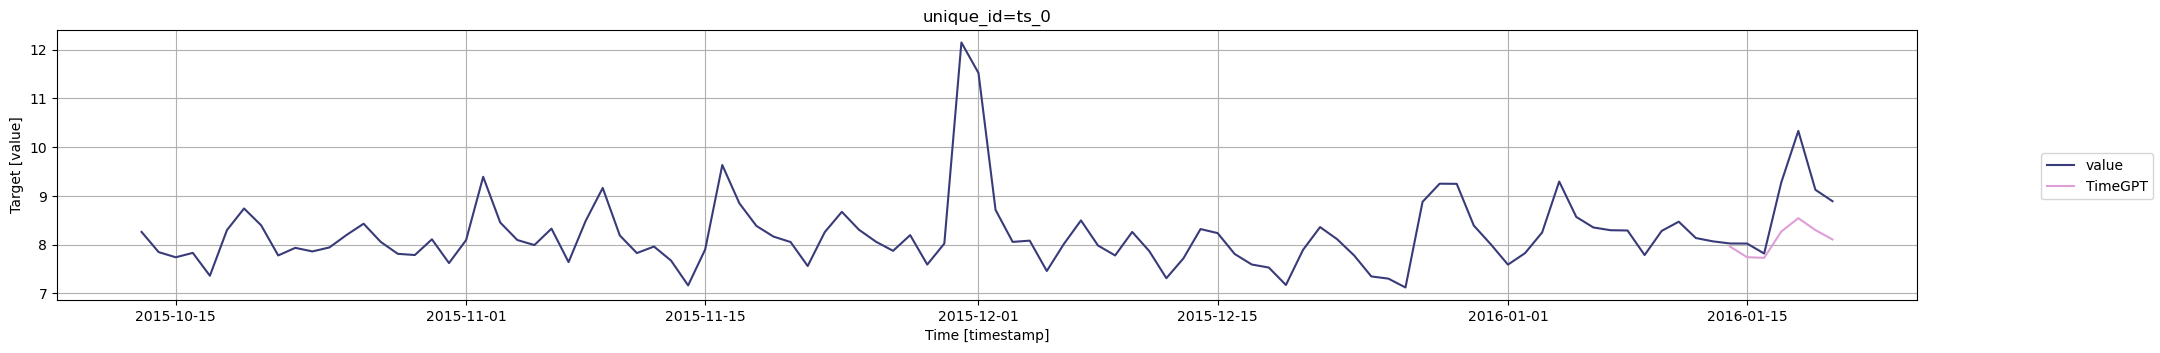
### Step 4: Plot Cross-Validation Results
Visualize forecast performance for each cutoff period. Here's an example plotting the last 100 rows of actual data along with cross-validation forecasts for each cutoff.
```python
cutoffs = timegpt_cv_df['cutoff'].unique()
for cutoff in cutoffs:
fig = nixtla_client.plot(
pm_df.tail(100),
timegpt_cv_df.query('cutoff == @cutoff').drop(columns=['cutoff', 'y']),
)
display(fig)
```
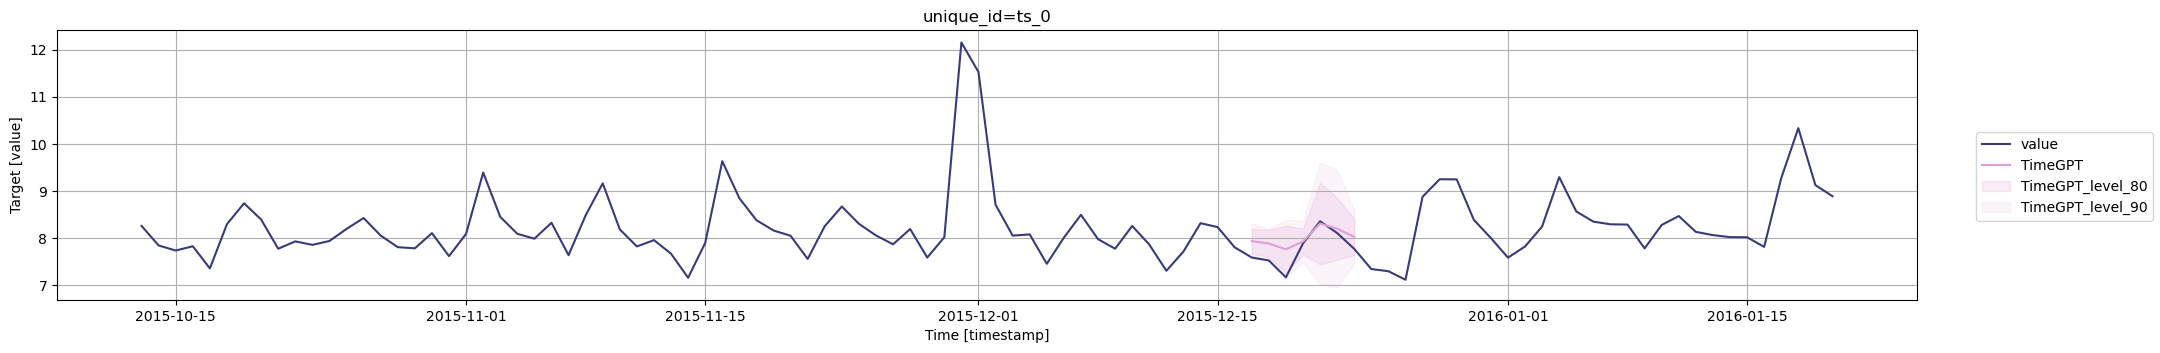
### Step 5: Generate Prediction Intervals for Model Uncertainty
It is also possible to generate prediction intervals during cross-validation. To do so, we simply use the `level` argument.
```python
timegpt_cv_df = nixtla_client.cross_validation(
pm_df,
h=7,
n_windows=5,
freq='D',
level=[80, 90],
)
timegpt_cv_df.head()
```
| | unique_id | ds | cutoff | y | TimeGPT | TimeGPT-hi-80 | TimeGPT-hi-90 | TimeGPT-lo-80 | TimeGPT-lo-90 |
|---|-----------|------------|------------|----------|----------|---------------|---------------|---------------|---------------|
| 0 | 0 | 2015-12-17 | 2015-12-16 | 7.591862 | 7.939553 | 8.201465 | 8.314956 | 7.677642 | 7.564151 |
| 1 | 0 | 2015-12-18 | 2015-12-16 | 7.528869 | 7.887512 | 8.175414 | 8.207470 | 7.599609 | 7.567553 |
| 2 | 0 | 2015-12-19 | 2015-12-16 | 7.171657 | 7.766617 | 8.267363 | 8.386674 | 7.265871 | 7.146560 |
| 3 | 0 | 2015-12-20 | 2015-12-16 | 7.891331 | 7.931502 | 8.205929 | 8.369983 | 7.657075 | 7.493020 |
| 4 | 0 | 2015-12-21 | 2015-12-16 | 8.360071 | 8.312632 | 9.184893 | 9.625794 | 7.440371 | 6.999469 |
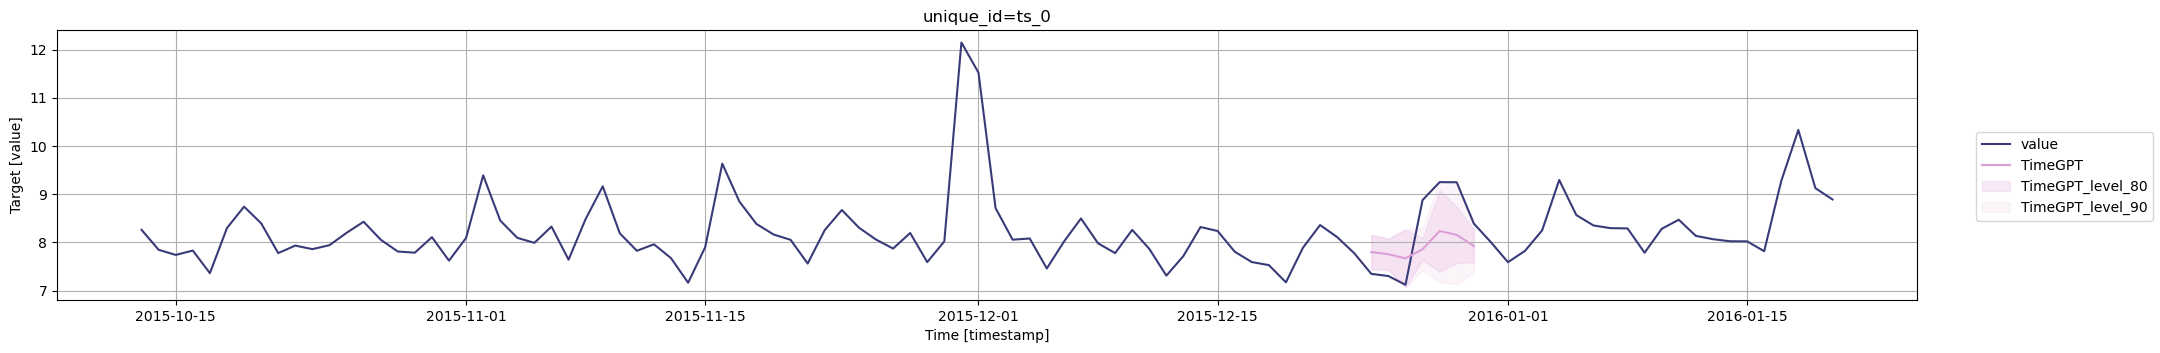
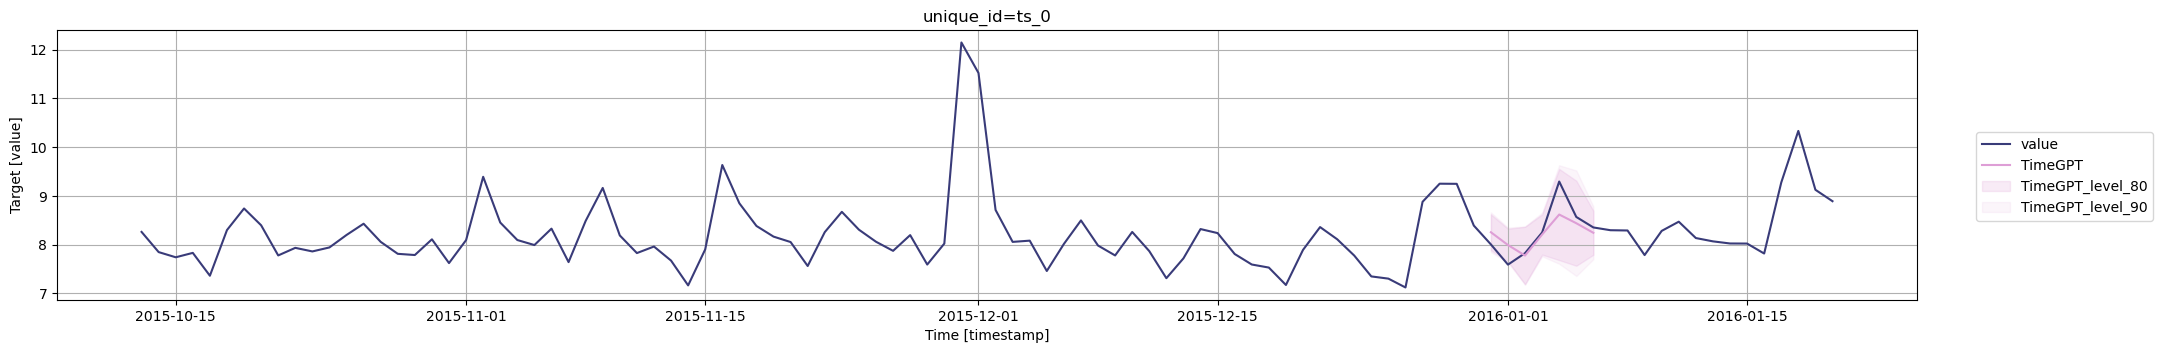
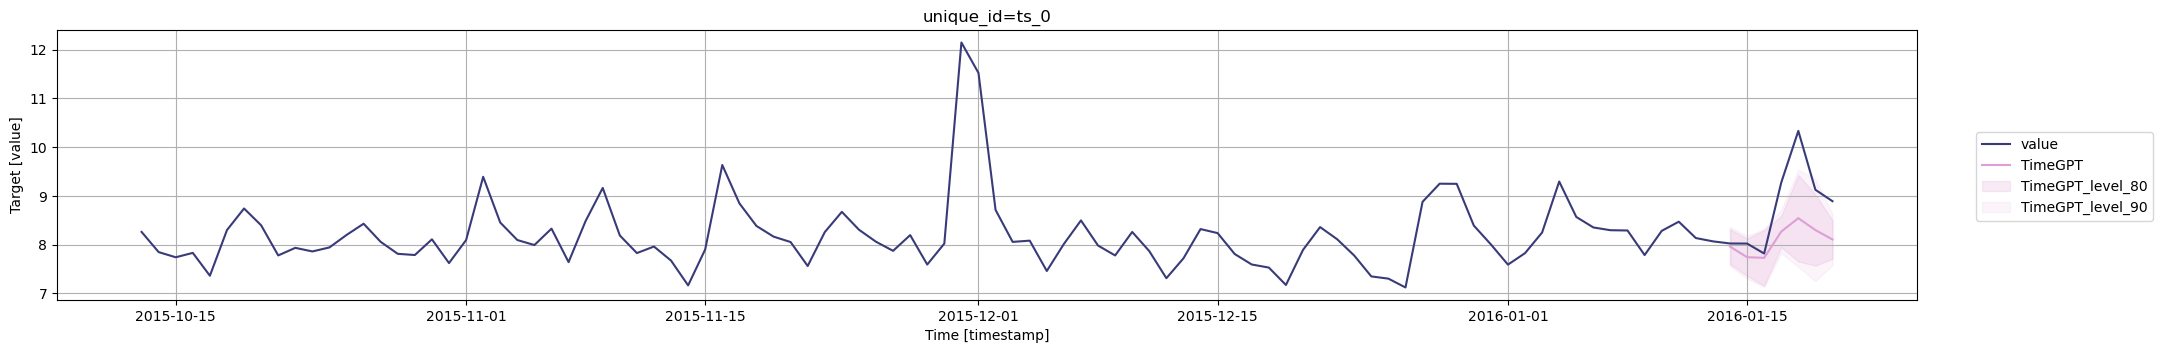
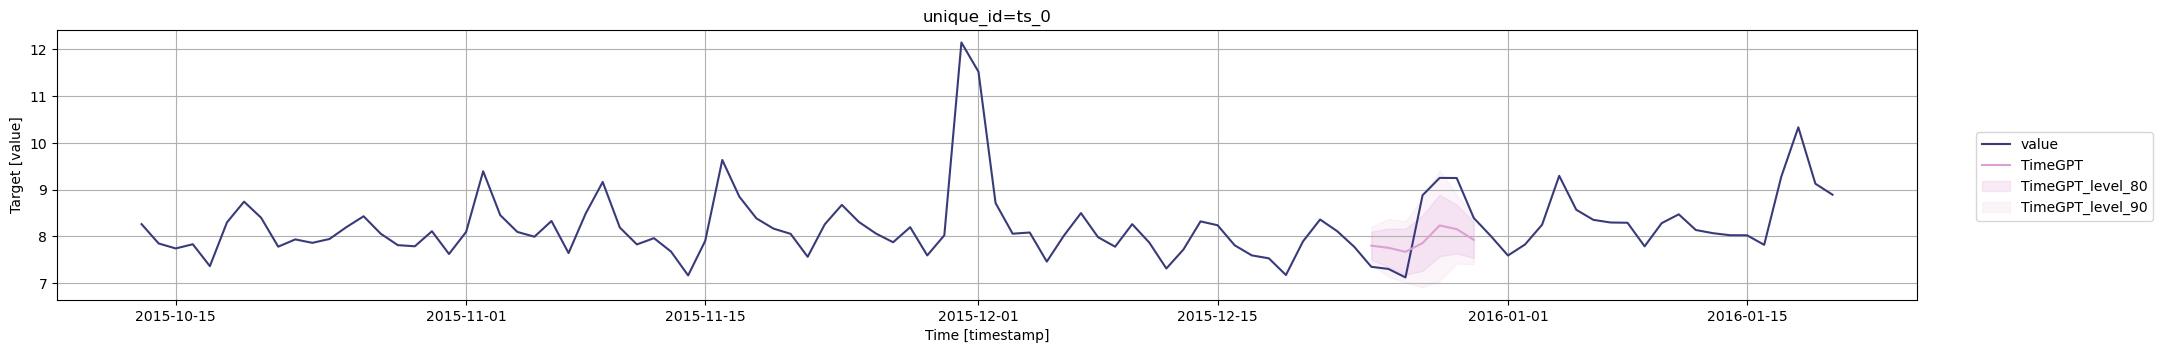
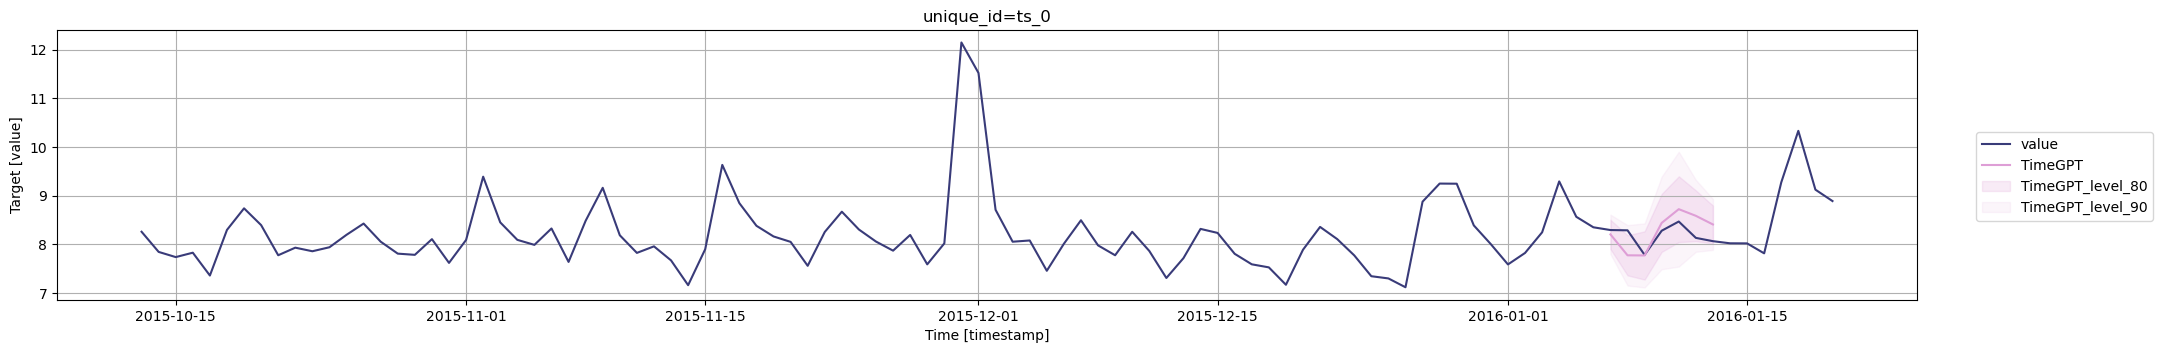
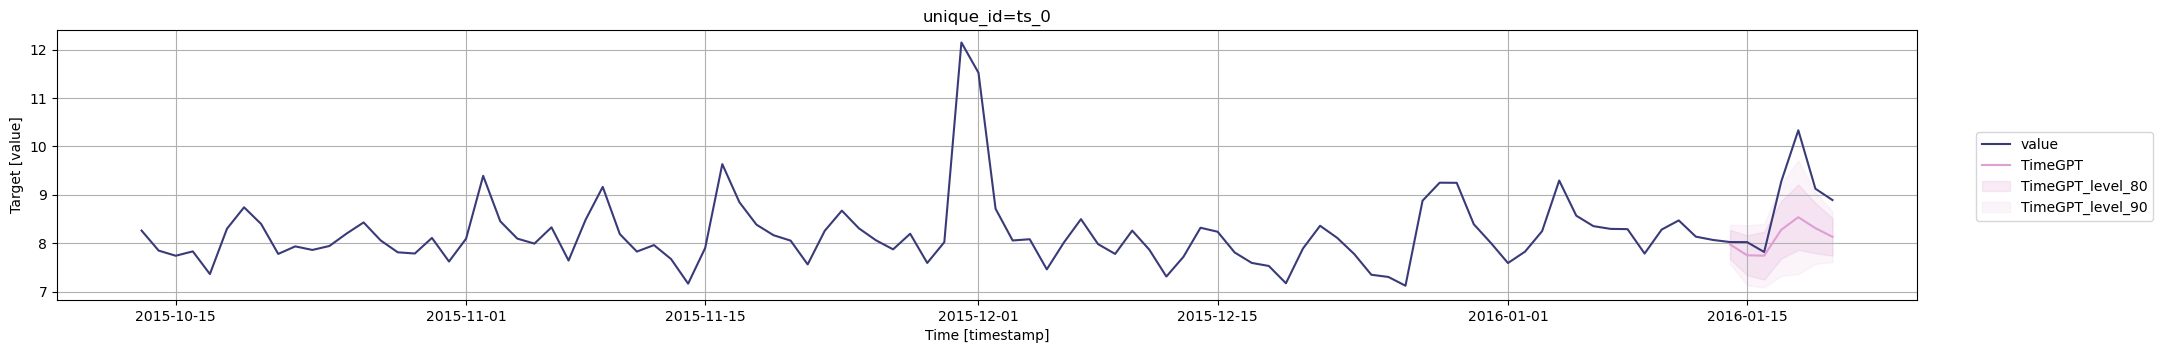
Plot the prediction intervals for the cross-validation results.
```python
cutoffs = timegpt_cv_df['cutoff'].unique()
for cutoff in cutoffs:
fig = nixtla_client.plot(
pm_df.tail(100),
timegpt_cv_df.query('cutoff == @cutoff').drop(columns=['cutoff', 'y']),
level=[80, 90],
models=['TimeGPT']
)
display(fig)
```

### Step 6: Enhance Forecasts with Exogenous Variables
#### Time Features
It is possible to include exogenous variables when performing cross-validation. Here we use the `date_features` parameter to create labels for each month. These features are then used by the model to make predictions during cross-validation.
```python
timegpt_cv_df = nixtla_client.cross_validation(
pm_df,
h=7,
n_windows=5,
freq='D',
date_features=['month'],
)
timegpt_cv_df.head()
```
| | unique_id | ds | cutoff | y | TimeGPT | TimeGPT-hi-80 | TimeGPT-hi-90 | TimeGPT-lo-80 | TimeGPT-lo-90 |
|---|-----------|------------|------------|----------|----------|---------------|---------------|---------------|---------------|
| 0 | 0 | 2015-12-17 | 2015-12-16 | 7.591862 | 8.426320 | 8.721996 | 8.824101 | 8.130644 | 8.028540 |
| 1 | 0 | 2015-12-18 | 2015-12-16 | 7.528869 | 8.049962 | 8.452083 | 8.658603 | 7.647842 | 7.441321 |
| 2 | 0 | 2015-12-19 | 2015-12-16 | 7.171657 | 7.509098 | 7.984788 | 8.138017 | 7.033409 | 6.880180 |
| 3 | 0 | 2015-12-20 | 2015-12-16 | 7.891331 | 7.739536 | 8.306914 | 8.641355 | 7.172158 | 6.837718 |
| 4 | 0 | 2015-12-21 | 2015-12-16 | 8.360071 | 8.027471 | 8.722828 | 9.152306 | 7.332113 | 6.902636 |
Plot the cross-validation results with the time features.
```python
cutoffs = timegpt_cv_df['cutoff'].unique()
for cutoff in cutoffs:
fig = nixtla_client.plot(
pm_df.tail(100),
timegpt_cv_df.query('cutoff == @cutoff').drop(columns=['cutoff', 'y']),
date_features=['month'],
models=['TimeGPT']
)
display(fig)
```


#### Dynamic Features
Additionally you can pass dynamic exogenous variables to better inform TimeGPT about the data. You just simply have to add the exogenous regressors after the target column.
```python
Y_df = pd.read_csv('https://raw.githubusercontent.com/Nixtla/transfer-learning-time-series/main/datasets/electricity.csv')
X_df = pd.read_csv('https://raw.githubusercontent.com/Nixtla/transfer-learning-time-series/main/datasets/exogenous-vars-electricity.csv')
df = Y_df.merge(X_df)
```
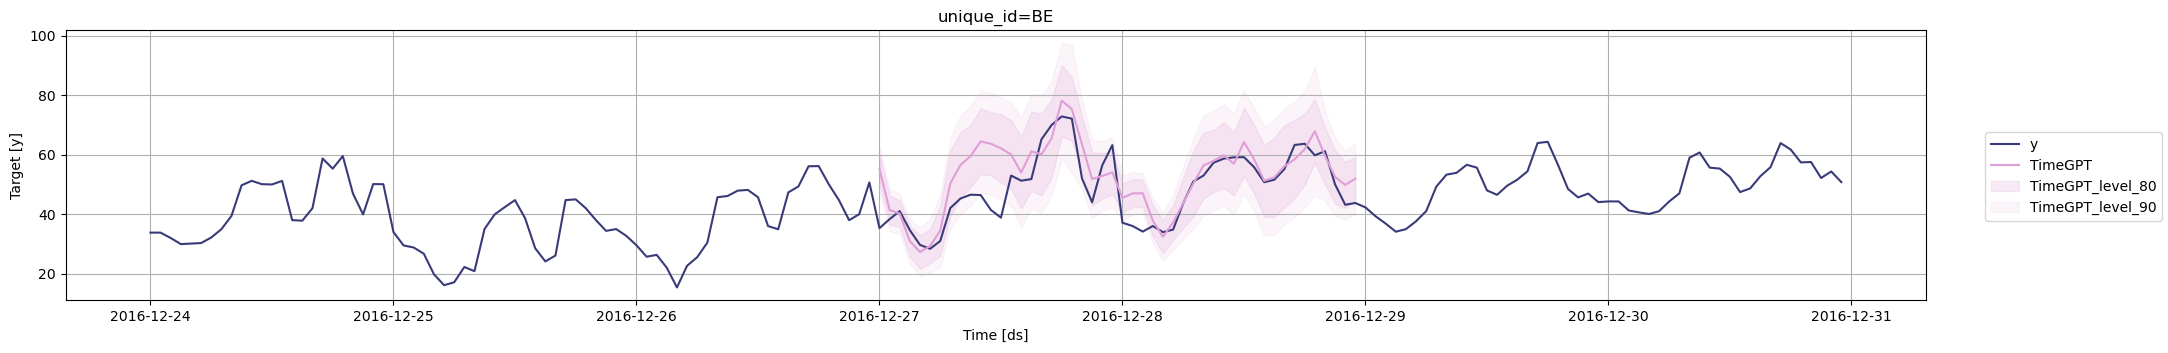
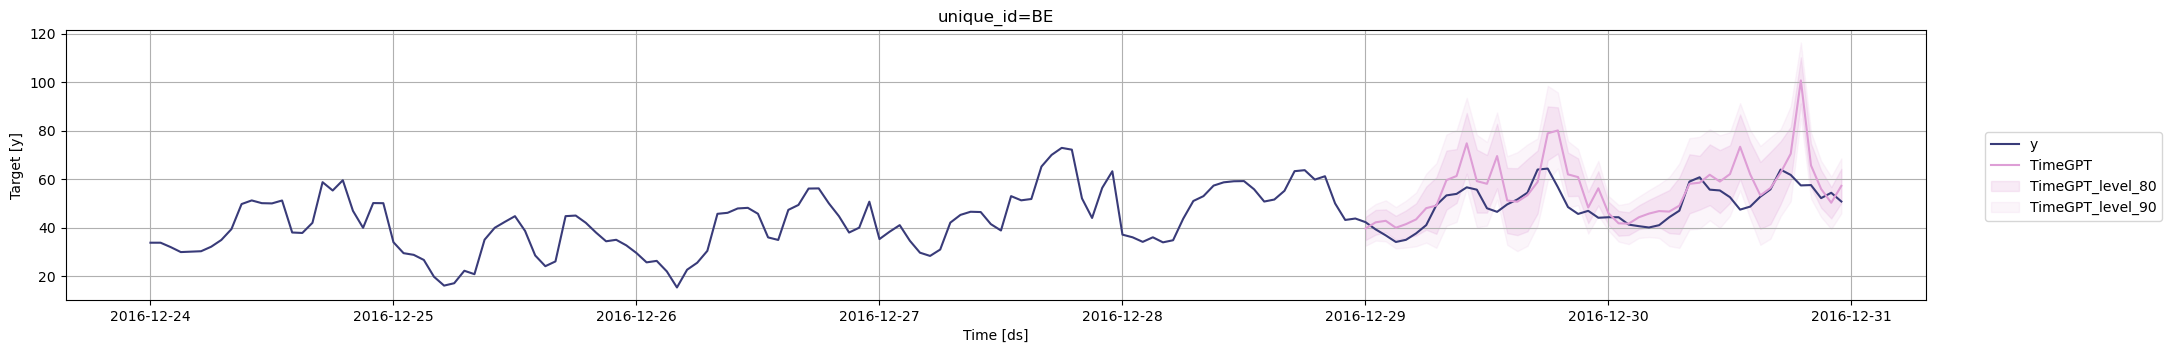
Now let's cross validate `TimeGPT` considering this information
```python
timegpt_cv_df_x = nixtla_client.cross_validation(
df.groupby('unique_id').tail(100 * 48),
h=48,
n_windows=2,
level=[80, 90]
)
cutoffs = timegpt_cv_df_x.query('unique_id == "BE"')['cutoff'].unique()
for cutoff in cutoffs:
fig = nixtla_client.plot(
df.query('unique_id == "BE"').tail(24 * 7),
timegpt_cv_df_x.query('cutoff == @cutoff & unique_id == "BE"').drop(columns=['cutoff', 'y']),
models=['TimeGPT'],
level=[80, 90],
)
display(fig)
```
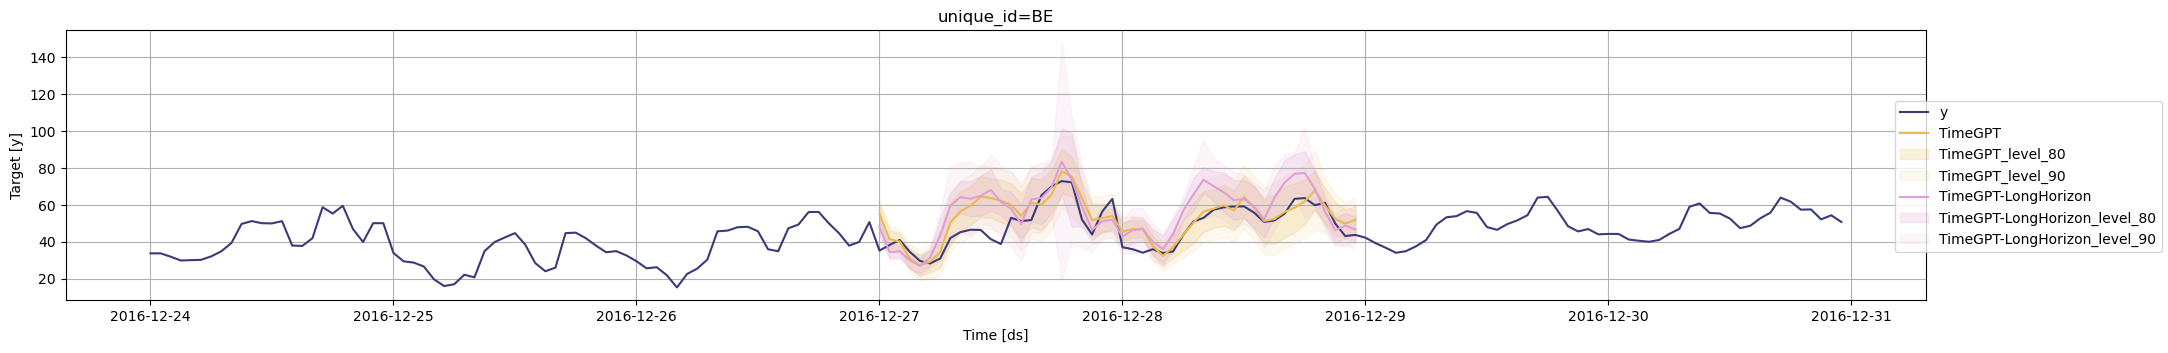
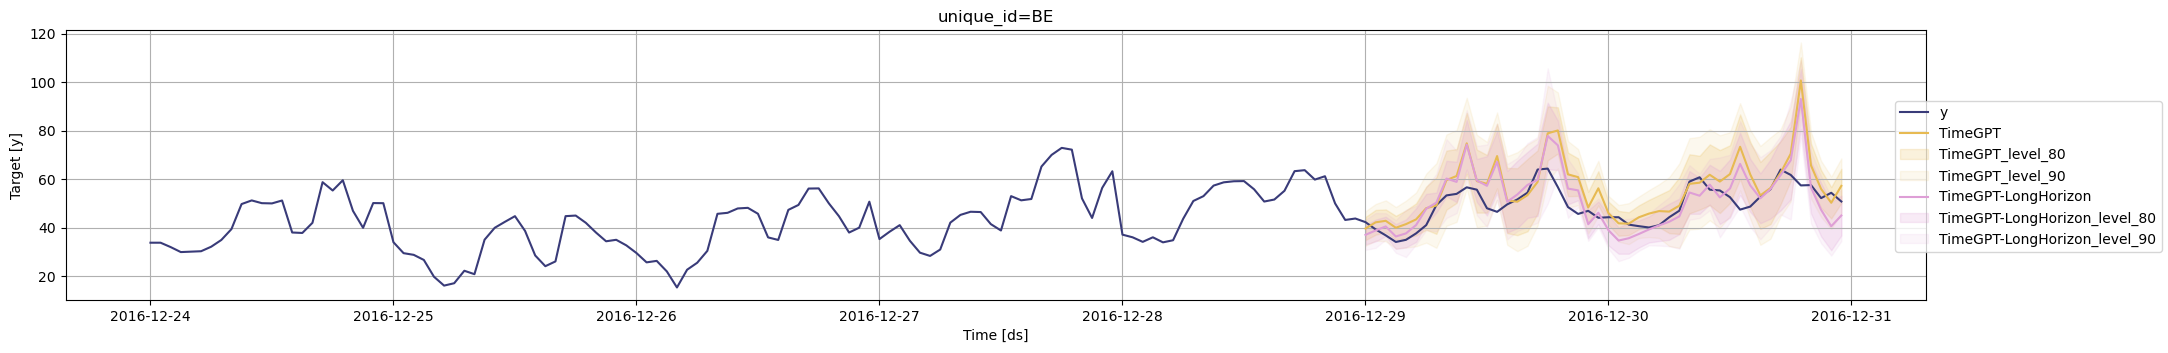
### Step 7: Long-Horizon Forecasting with TimeGPT
Also, you can generate cross validation for different instances of `TimeGPT` using the `model` argument. Here we use the base model and the model for long-horizon forecasting.
```python
timegpt_cv_df_x_long_horizon = nixtla_client.cross_validation(
df.groupby('unique_id').tail(100 * 48),
h=48,
n_windows=2,
level=[80, 90],
model='timegpt-1-long-horizon',
)
timegpt_cv_df_x_long_horizon.columns = timegpt_cv_df_x_long_horizon.columns.str.replace('TimeGPT', 'TimeGPT-LongHorizon')
timegpt_cv_df_x_models = timegpt_cv_df_x_long_horizon.merge(timegpt_cv_df_x)
cutoffs = timegpt_cv_df_x_models.query('unique_id == "BE"')['cutoff'].unique()
for cutoff in cutoffs:
fig = nixtla_client.plot(
df.query('unique_id == "BE"').tail(24 * 7),
timegpt_cv_df_x_models.query('cutoff == @cutoff & unique_id == "BE"').drop(columns=['cutoff', 'y']),
models=['TimeGPT', 'TimeGPT-LongHorizon'],
level=[80, 90],
)
display(fig)
```
## Frequently Asked Questions
**What is time series cross-validation?**
Time series cross-validation is a model validation technique that uses rolling windows to evaluate forecasting accuracy while preserving temporal order, ensuring reliable predictions on unseen data.
**How is time series cross-validation different from k-fold cross-validation?**
Unlike k-fold cross-validation which randomly shuffles data, time series cross-validation maintains temporal order using techniques like walk-forward validation and expanding windows to prevent data leakage.
**What are the key parameters for cross-validation in TimeGPT?**
Key parameters include `h` (forecast horizon), `n_windows` (number of validation windows), `step_size` (window increment), and `level` (prediction interval confidence levels).
**How do you evaluate cross-validation results?**
Evaluate results by comparing forecasted values against actual values across multiple time windows, analyzing prediction intervals, and calculating metrics like MAE, RMSE, and MAPE.
## Conclusion
You've mastered time series cross-validation with TimeGPT, including rolling-window validation, prediction intervals, exogenous variables, and long-horizon forecasting. These model validation techniques ensure your forecasts are accurate, reliable, and production-ready.
### Next Steps in Model Validation
- Explore [evaluation metrics](/forecasting/evaluation/evaluation_metrics) to quantify forecast accuracy
- Learn about [fine-tuning TimeGPT](/forecasting/fine-tuning/steps) for domain-specific data
- Apply cross-validation to [multiple time series](/data_requirements/multiple_series)
Ready to validate your forecasts at scale? [Start your TimeGPT trial](https://dashboard.nixtla.io/) and implement robust cross-validation today.