---
title: "Missing Values"
description: "Learn how to handle missing values in time series data for accurate forecasting with TimeGPT."
icon: "table"
---
## Missing Values in Time Series
TimeGPT requires time series data without missing values. While you may have
multiple series starting and ending on different dates, each one must maintain
a continuous data sequence.
This tutorial shows you how to handle missing values for use with TimeGPT. For
reference, this tutorial is based on the skforecast tutorial:
[Forecasting Time Series with Missing Values](https://cienciadedatos.net/documentos/py46-forecasting-time-series-missing-values).
Managing missing values ensures your forecasts with TimeGPT are accurate and reliable.
When dates or values are missing, fill or interpolate them according to the nature of your dataset.
## Tutorial
[](https://colab.research.google.com/github/Nixtla/nixtla/blob/main/nbs/docs/tutorials/15_missing_values.ipynb)
### Step 1: Load Data
Load the daily bike rental counts dataset using pandas. Note that the original column names are in Spanish; you will rename them to match `ds` and `y`.
```python
import pandas as pd
df = pd.read_csv('https://raw.githubusercontent.com/JoaquinAmatRodrigo/Estadistica-machine-learning-python/master/data/usuarios_diarios_bicimad.csv')
df = df[['fecha', 'Usos bicis total día']]
df.rename(columns={'fecha': 'ds', 'Usos bicis total día': 'y'}, inplace=True)
df.head()
```
| | ds | y |
| ----- | ------------ | ----- |
| 0 | 2014-06-23 | 99 |
| 1 | 2014-06-24 | 72 |
| 2 | 2014-06-25 | 119 |
| 3 | 2014-06-26 | 135 |
| 4 | 2014-06-27 | 149 |
Next, convert your dates to timestamps and assign a unique identifier (`unique_id`) to handle multiple series if needed:
```python
df['ds'] = pd.to_datetime(df['ds'])
df['unique_id'] = 'id1'
df = df[['unique_id', 'ds', 'y']]
```
Reserve the last 93 days for testing:
```python
train_df = df[:-93]
test_df = df[-93:]
```
To simulate missing data, remove specific date ranges from the training dataset:
```python
mask = ~((train_df['ds'] >= '2020-09-01') & (train_df['ds'] <= '2020-10-10')) & \
~((train_df['ds'] >= '2020-11-08') & (train_df['ds'] <= '2020-12-15'))
train_df_gaps = train_df[mask]
```
### Step 2: Initialize TimeGPT
Initialize a `NixtlaClient` object with your Nixtla API key:
```python
from nixtla import NixtlaClient
nixtla_client = NixtlaClient(api_key='my_api_key_provided_by_nixtla')
```
### Step 3: Visualize Data
Plot your dataset and examine the gaps introduced above:
```python
nixtla_client.plot(train_df_gaps)
```

Note that there are two gaps in the data: from September 1, 2020, to October 10,
2020, and from November 8, 2020, to December 15, 2020. To better visualize these
gaps, you can use the `max_insample_length` argument of the `plot` method or you
can simply zoom in on the plot.
```python
nixtla_client.plot(train_df_gaps, max_insample_length=800)
```
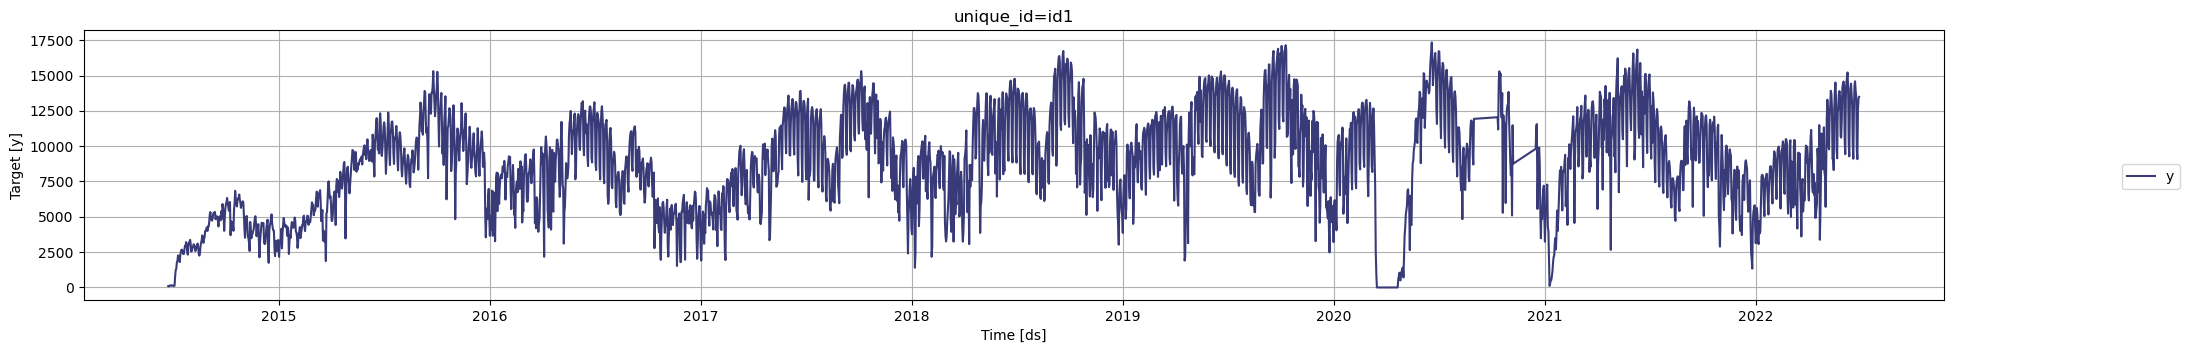
Additionally, notice a period from March 16, 2020, to April 21, 2020, where the
data shows zero rentals. These are not missing values, but actual zeros
corresponding to the COVID-19 lockdown in the city.
### Step 4: Fill Missing Values
You can use `fill_gaps` from `utilsforecast` to insert the missing dates:
Before using TimeGPT, we need to ensure that:
1. All timestamps from the start date to the end date are present in the data.
2. The target column contains no missing values.
To address the first issue, we will use the `fill_gaps` function from `utilsforecast`,
a Python package from Nixtla that provides essential utilities for time series
forecasting, such as functions for data preprocessing, plotting, and evaluation.
The `fill_gaps` function will fill in the missing dates in the data. To do this,
it requires the following arguments:
- `df`: The DataFrame containing the time series data.
- `freq` (str or int): The frequency of the data.
```python
from utilsforecast.preprocessing import fill_gaps
print('Number of rows before filling gaps:', len(train_df_gaps))
train_df_complete = fill_gaps(train_df_gaps, freq='D')
print('Number of rows after filling gaps:', len(train_df_complete))
```
```bash
Number of rows before filling gaps: 2851
Number of rows after filling gaps: 2929
```
> NOTE: In this tutorial, the data contains only one time series. However, TimeGPT
supports passing multiple series to the model. In this case, none of the time
series can have missing values from their individual earliest timestamp until
their individual latest timestamp. If these individual time series have missing
values, the user must decide how to fill these gaps for the individual time
series. The `fill_gaps` function provides a couple of additional arguments to
assist with this (refer to the documentation for complete details), namely
`start` and `end`.
Now we need to decide how to fill the missing values in the target column. In
this tutorial, we will use interpolation, but it is important to consider the
specific context of your data when selecting a filling strategy. For example,
if you are dealing with daily retail data, a missing value most likely indicates
that there were no sales on that day, and you can fill it with zero. Conversely,
if you are working with hourly temperature data, a missing value probably means
that the sensor was not functioning, and you might prefer to use interpolation
to fill the missing values.
In this case, we will handle the newly inserted missing values by interpolation.
```python
train_df_complete['y'] = train_df_complete['y'].interpolate(
method='linear', limit_direction='both'
)
train_df_complete.isna().sum()
```
```bash
unique_id 0
ds 0
y 0
dtype: int64
```
### Step 5: Forecast with TimeGPT
Typically, a horizon > 2 times the typical seasonality is considered long. In
this case, the data has a seasonality of 7 days and a horizon of 93 days.
Since the forecast horizon is long compared to the frequency of the data (daily),
we will use `timegpt-1-long-horizon` model.
```python
fcst = nixtla_client.forecast(
train_df_complete,
h=len(test_df),
model='timegpt-1-long-horizon'
)
```
Visualize the forecasts against the actual test data:
```python
nixtla_client.plot(test_df, fcst)
```
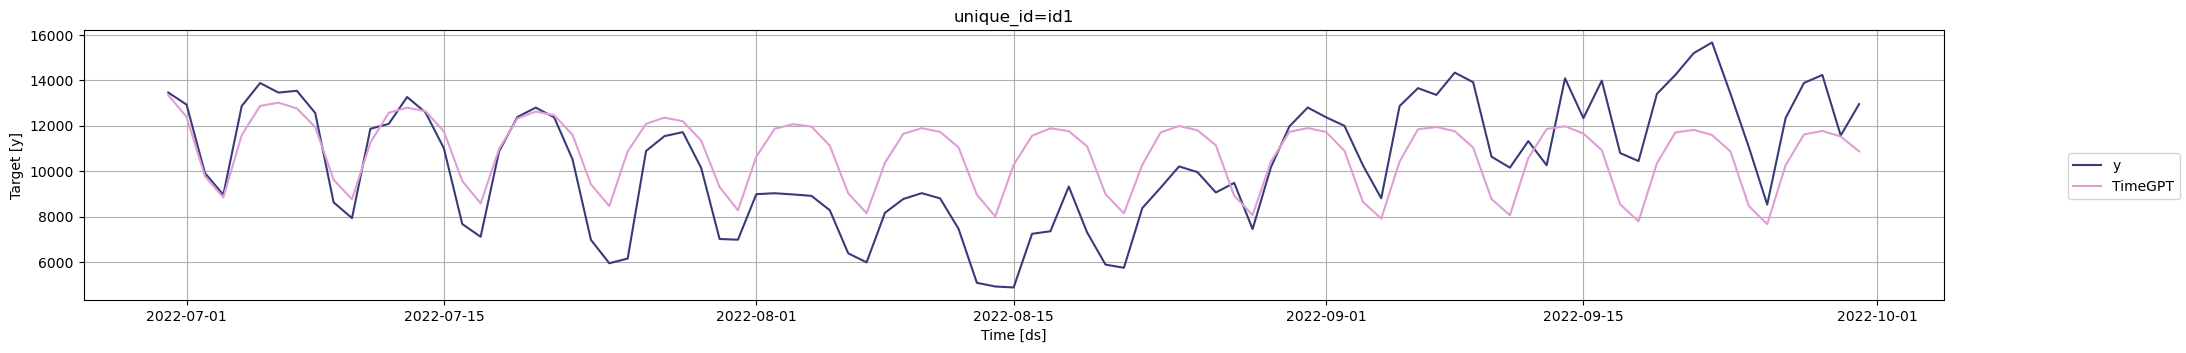
Evaluate performance using `utilsforecast`. We will use Mean Absolute Error (MAE)
as the evaluation metric, but you can choose others like MSE, RMSE, etc.:
```python
from utilsforecast.evaluation import evaluate
from utilsforecast.losses import mae
fcst['ds'] = pd.to_datetime(fcst['ds'])
result = test_df.merge(fcst, on=['ds', 'unique_id'], how='left')
evaluate(result, metrics=[mae])
```
| | unique_id | metric | TimeGPT |
| ----- | ----------- | -------- | ------------- |
| 0 | id1 | mae | 1824.693059 |
### Step 6: Conclusion
- Always ensure that your data is free of missing dates and values before forecasting with TimeGPT.
- Select a gap-filling strategy based on your domain knowledge (linear interpolation, constant filling, etc.).
## References
- [Exclude COVID Impact in Time Series Forecasting](https://www.cienciadedatos.net/documentos/py45-weighted-time-series-forecasting.html)
- [Forecasting Time Series with Missing Values](https://cienciadedatos.net/documentos/py46-forecasting-time-series-missing-values.html)